On 23rd of April 2015, Mihai Șucan passed away due to metastatic cancer caused by
RDEB.
My name is Mihai and I work on the
Firefox developer tools. When it comes to web development, I like
both server-side and client-side work. I am mainly interested in web browsers, web standards and related
technologies.
24 March 2014, 17:01
Hello Mozillians!
This is just a quick note to the blog readers about a new page on
MDN:
How to customize the Firefox Web Console output. The API presented is fully available in the Aurora channel,
and partially available in the beta release channel.
I hope add-on authors interested to extend the developer tools will find the documentation useful.
Published in:
documentation, firefox, mozilla, web console.
12 March 2014, 11:12
Hello Mozillians!
We are really close to the next Firefox release, which will happen next week. This is a rundown of Web Console changes in current Firefox release channels.
Here is a really nice introduction video for the Web Console, made by Will Bamberg:
You can learn more about the Web Console on Mozilla's
Developer Network web site.
Stable release (Firefox 27)
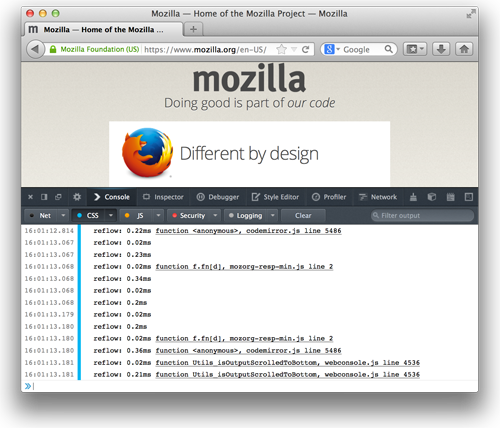
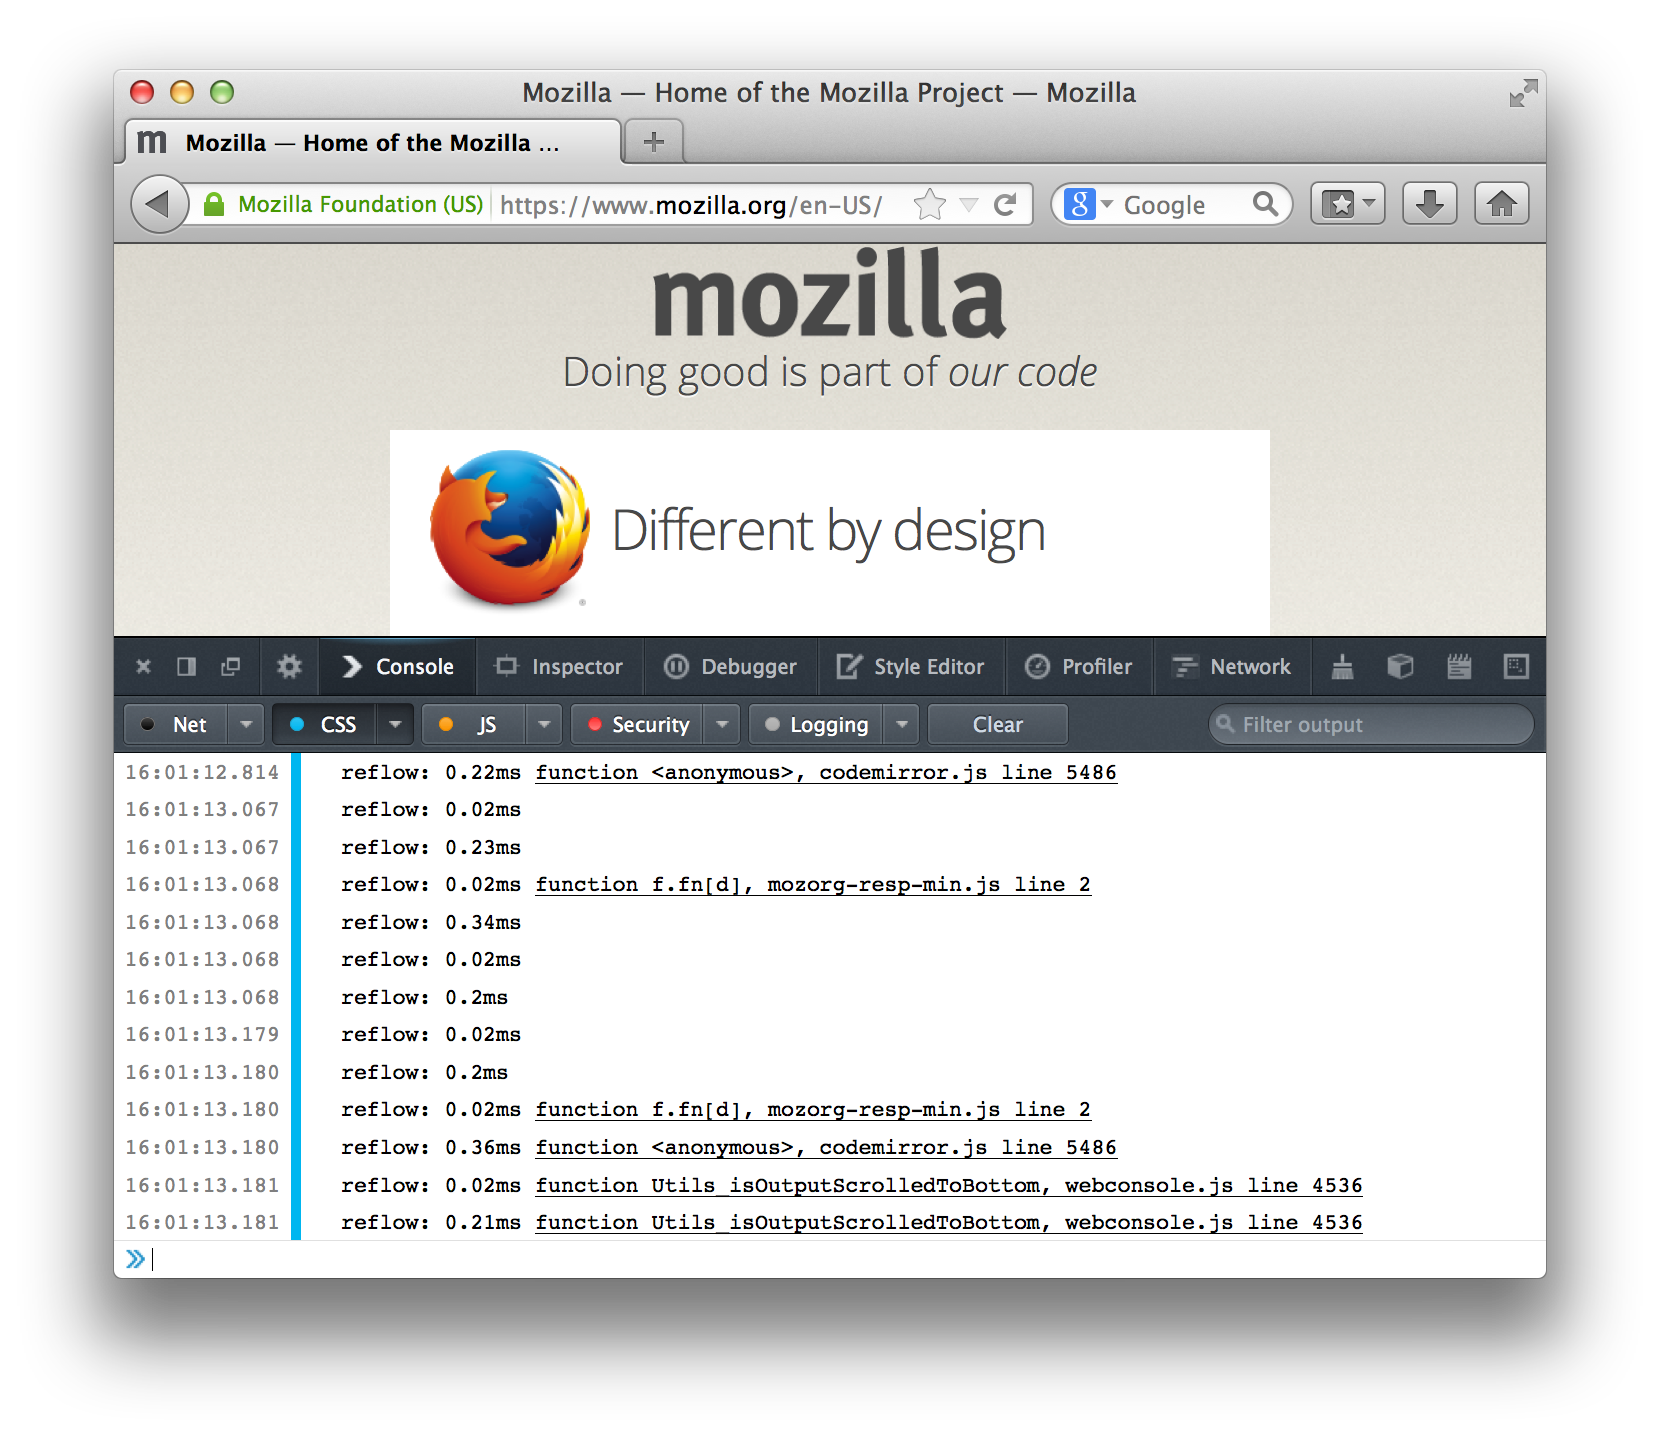
Added page reflow logging. Enable this in the "CSS > Log" menu option (bug 926371).
You can use the -jsconsole command line option when you start Firefox to automatically start the Browser Console (bug 860672).
Added split console: you can press Escape in any tool to quickly open the console (bug 862558).
Added support for console.assert() (bug 760193).
Added console.exception() as an alias for the
console.error() method (bug 922214).
Autocomplete for JavaScript input provides suggestions from the currently selected stackframe in the JS Debugger
(bug 842682).
Added option to toggle the display of message timestamps in the console output (bug 722267).
Added a dark theme for the console output.
CSS warnings disabled by default (bug 909756).
Added the console API to Web Workers (bug 620935). Now you can log messages to the Web Console from Web Workers.
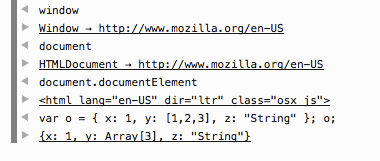
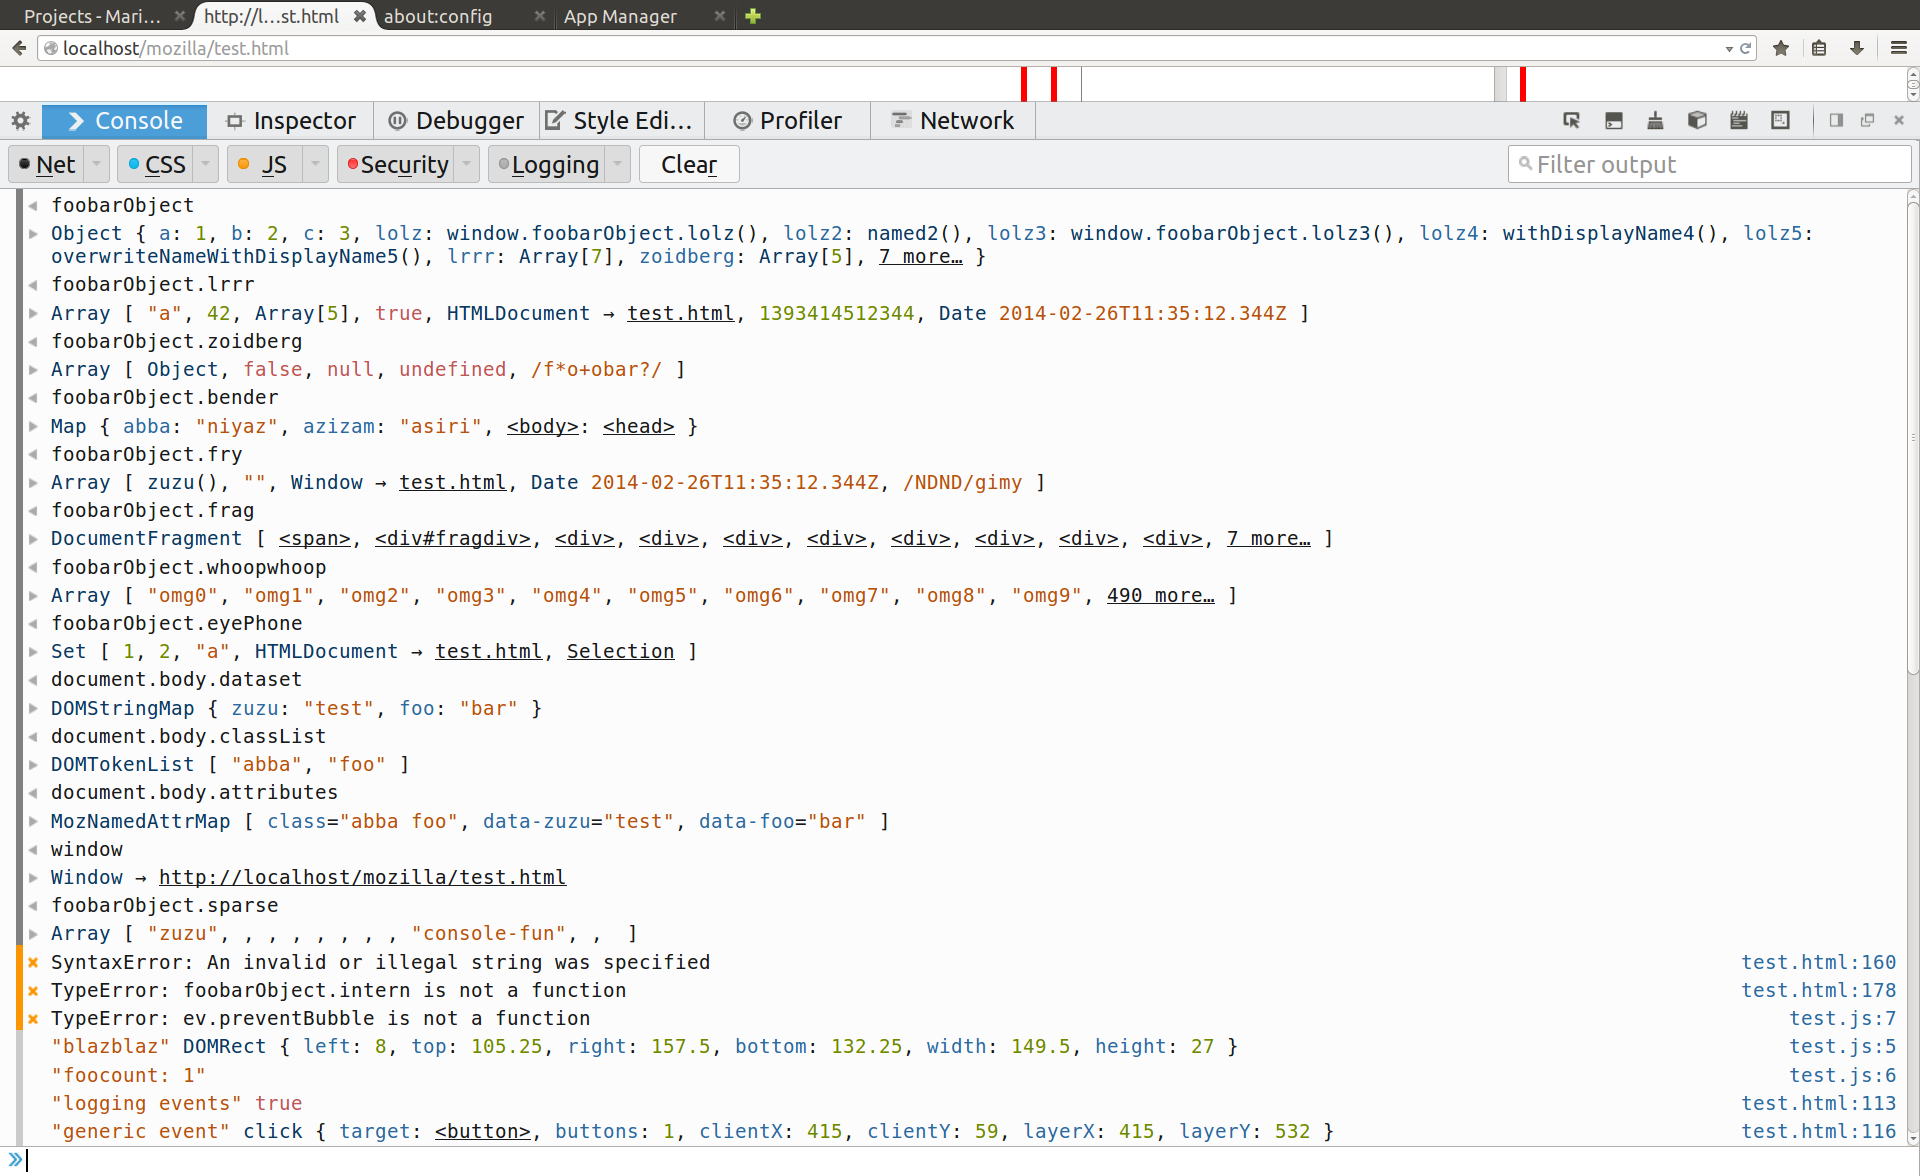
Pretty output for objects in the console output. You can now see previews of object properties, array elements, DOM
elements, node lists, and more (bug 843004).
Compact object previews are also used in the object inspector, which is also used by the JS Debugger.
The changes made in bug 843004 also include new APIs that allow custom message output to the Web Console. You can
customize output for different object types as well.
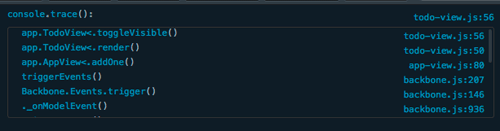
Nicer output for console.trace() - inline display of stack frames with syntax highlighting (bug 939783).
Now the input line is focused when you click anywhere in the console output (bug 960695).
Added cd() support. Now you can execute code in iframes/frames (bug 609872).
-
cd(someWindowObject) switch the JS evaluation scope to the given global window object - you can get it from
iframes using
iframeElement.contentWindow.
-
cd('.selector iframe') - for ease of use you can specify a CSS selector that matches the iframe you want
to use as eval scope.
-
cd(iframeDOMElement) - you can also point to the
<iframe> DOM element.
- use
cd() with no arguments to reset eval scope to the top window.
Note that cd() is also available in Scratchpad.
Rich previews for objects (bug 584733): syntax
highlighting, you can click on property values/array elements to inspect those objects directly, DOM node lists and
more.
DOM elements are now highlighted in the page when you hover the DOM element in the console output (bug 757866). An inspector icon is also included - click it to jump to see the DOM element in the markup view.
Added support for pretty output of objects in the Browser Console as well (bug 952190).
Network requests are now logged when you connect to Firefox OS (bug 917227). This affects both the Web Console and Network Monitor tools.
Added console.count() (bug 922208).
Autocomplete for array members, so now you can type
myArray[2].foo to get suggestions (bug 943586).
Ctrl/Cmd-Shift-K no longer toggles the Web Console. To close the developer tools use Ctrl/Cmd-Shift-I or
F12. Ctrl/Cmd-Shift-K is now used to focus the Web Console JS input if it is not already focused.
See
Rob's blog post for details and bug 612253 for the development notes.
The Browser Console no longer shows the JavaScript input by default (bug 922161). Set devtools.chrome.enabled to
true in about:config to get back the input.
JavaScript warnings and network logging are disabled by default (bug 966692).
Big thanks to all of the contributors who made patches to fix and improve the Web Console.
Next week we will start work for Firefox 31. If you are a developer I recommend you to use aurora or nightly builds to
get the best of our devtools.
Published in:
firefox, mozilla, web console.
29 May 2013, 16:21
Hello Mozillians!
Today's Firefox Nightly
(May 29, 2013) no longer has the Error Console enabled by default. It has been replaced by the Browser Console which shows
all of the same errors, warnings and messages as the Error Console and more: network logging and window.console API logging from all content and chrome windows - including extensions! It also has a better UI, you can filter messages,
evaluate JS with chrome privileges and inspect objects.
If you find missing messages, please file bugs as soon as possible in the "Developer
Tools: Console" component. Thank you!
The Browser Console shares the same code with the Web Console. This means you will get all of the improvements we are
working on - we are gearing up for a console output UI rewrite.
If you want to enable the Error Console you can change the
devtools.errorconsole.enabled option to
true from about:config.
Pro tip: in your Firefox chrome code (including extensions) you can do:
Cu.import("resource://gre/modules/devtools/Console.jsm");
console.log("hello", yourObject);
The above code will output to the Browser Console if you have it open - you can inspect objects, print stack traces (console.trace()) and do a bit of timing (console.time("foo") /
console.timeEnd("foo")).
Have fun!
Update: these changes should have no impact in Thunderbird, XULRunner or any other applications. Currently
the changes are limited to hiding the Error Console menu item from Firefox by default, and the Ctrl/Cmd-Shift-J keyboard shortcut now opens the Browser Console instead of the Error Console.
Published in:
devtools, mozilla, web console.
9 April 2013, 21:12
Today we just landed three new Web Console features you can play with in tomorrow's Firefox Nightly builds!
On a related note, Victor Porof also landed the new network monitor which gives you a very nice UI for working with
the log of network requests and responses. The new tool uses the
Web Console actors we worked on for making the Web Console remotable - both tools share the same network logging mechanism.
Evaluate JavaScript in the current stackframe
Whenever you are debugging a script in the page you can now evaluate JavaScript and inspect objects from the Web
Console. Make sure you select in which stackframe you want to evaluate your code - just switch to the desired frame in
the Debugger view. Until today the Web Console locked up while debugging pages. For technical details, see bug 783499.
This feature required a number of important changes. The Web Console now uses only the
debugger API to access the content JS objects. With these changes we are fixing a number of bugs reports by users.
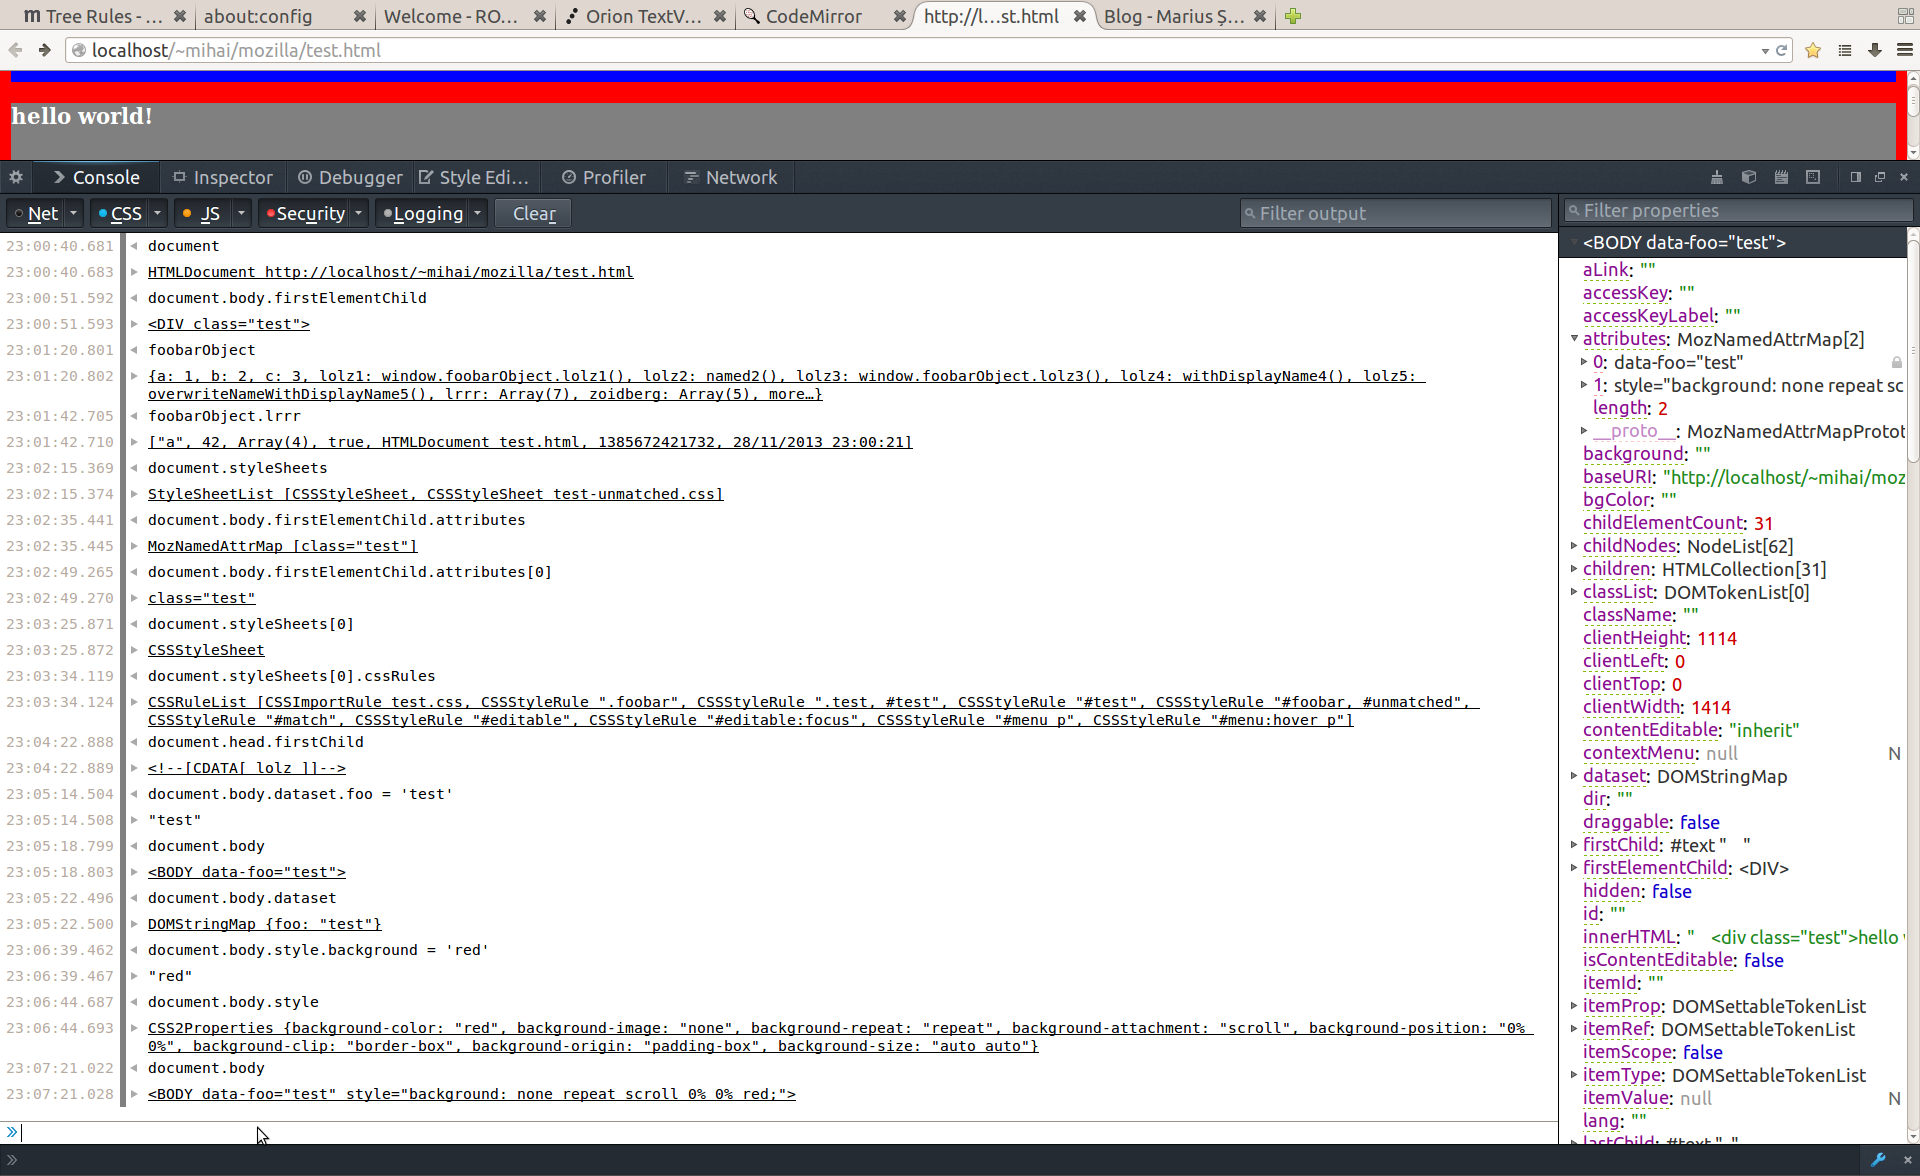
New object inspector
The old object inspector popup has been replaced with the same variables view from the debugger, allowing us to fix
long standing issues with the old inspector. This is not just pretty UI: you can now filter/search through the
properties by name and value, edit property name and value, delete properties, and more. You can also use
JavaScript helper functions from the web console, inside the variables view: when you edit a value you can just write
$("foo") or whatever you wish.
With this change object inspection works slightly different: you will notice that many of the methods and properties
of DOM objects show in the prototype of the objects you inspect. The switch to the debugger API brings the Web Console
in line with the JavaScript debugger.
The new Browser Console
To enable the Browser Console make sure you set
devtools.chrome.enabled to true in about:config (Firefox restart is
needed). Open the Browser Console from the Web Developer > Browser Console menu item.
The new Console is meant for browser and addon developers: you can see all of window.console API calls, from
all windows, all script and style errors/warnings, and all network requests from all over the browser and from addons.
We plan to replace the Error Console with the Browser Console as soon as possible: the Error Console provides users
with less capabilities than the Browser Console, and it is not remotable. You can currently connect to any Firefox
Mobile, Firefox OS and Firefox for desktop instance and see all of the logs in the Browser Console from the remote
instance.
Given the amount of logging happening we plan to support better ways of filtering output. For example, we would like
to allow developers to filter messages by addon.
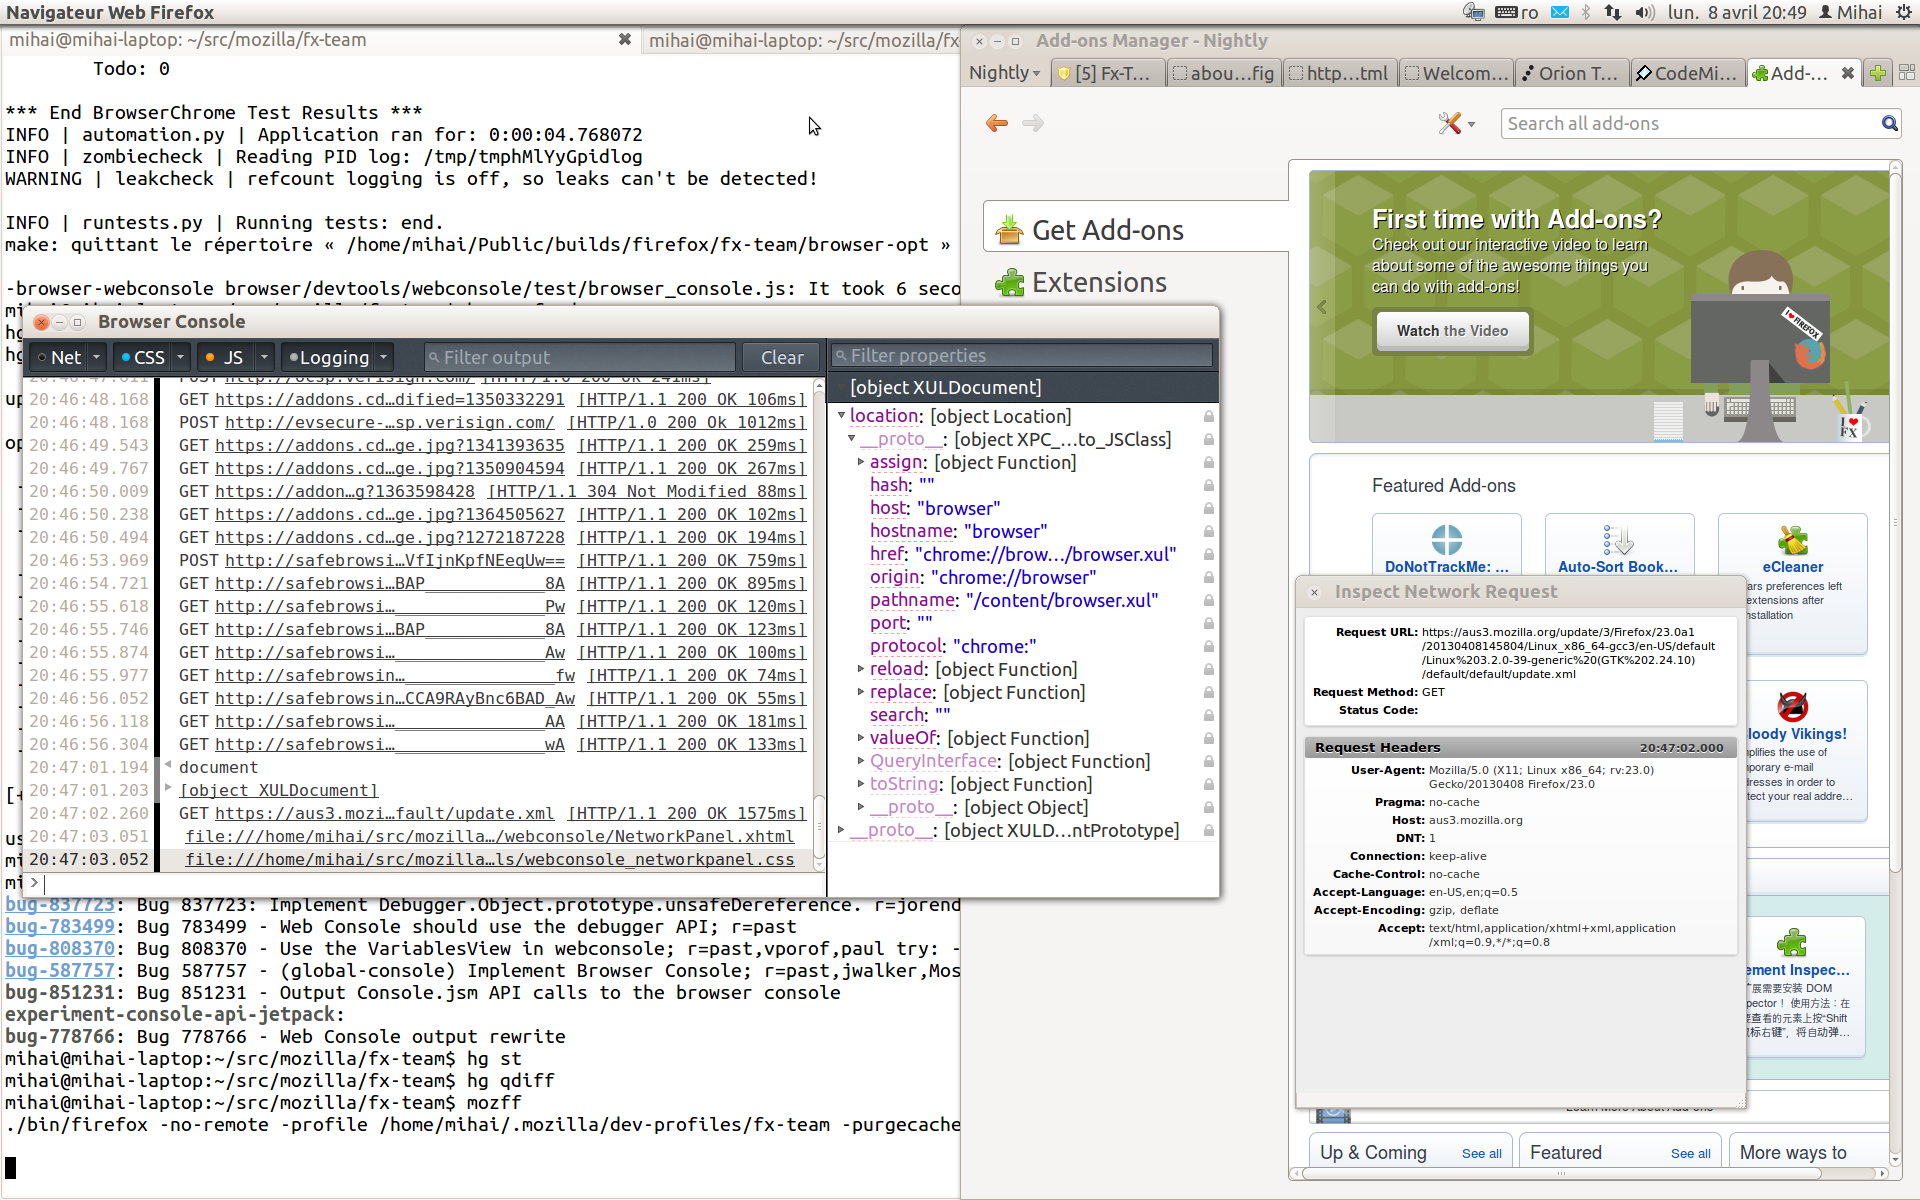
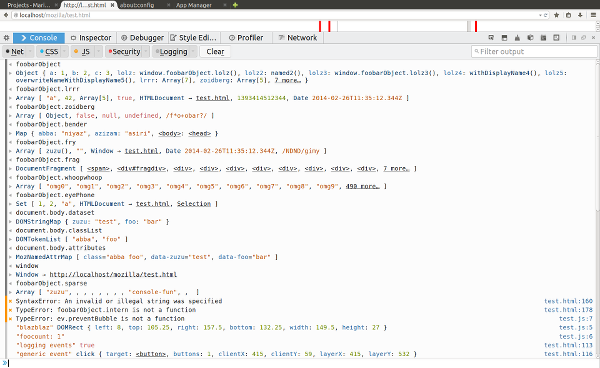
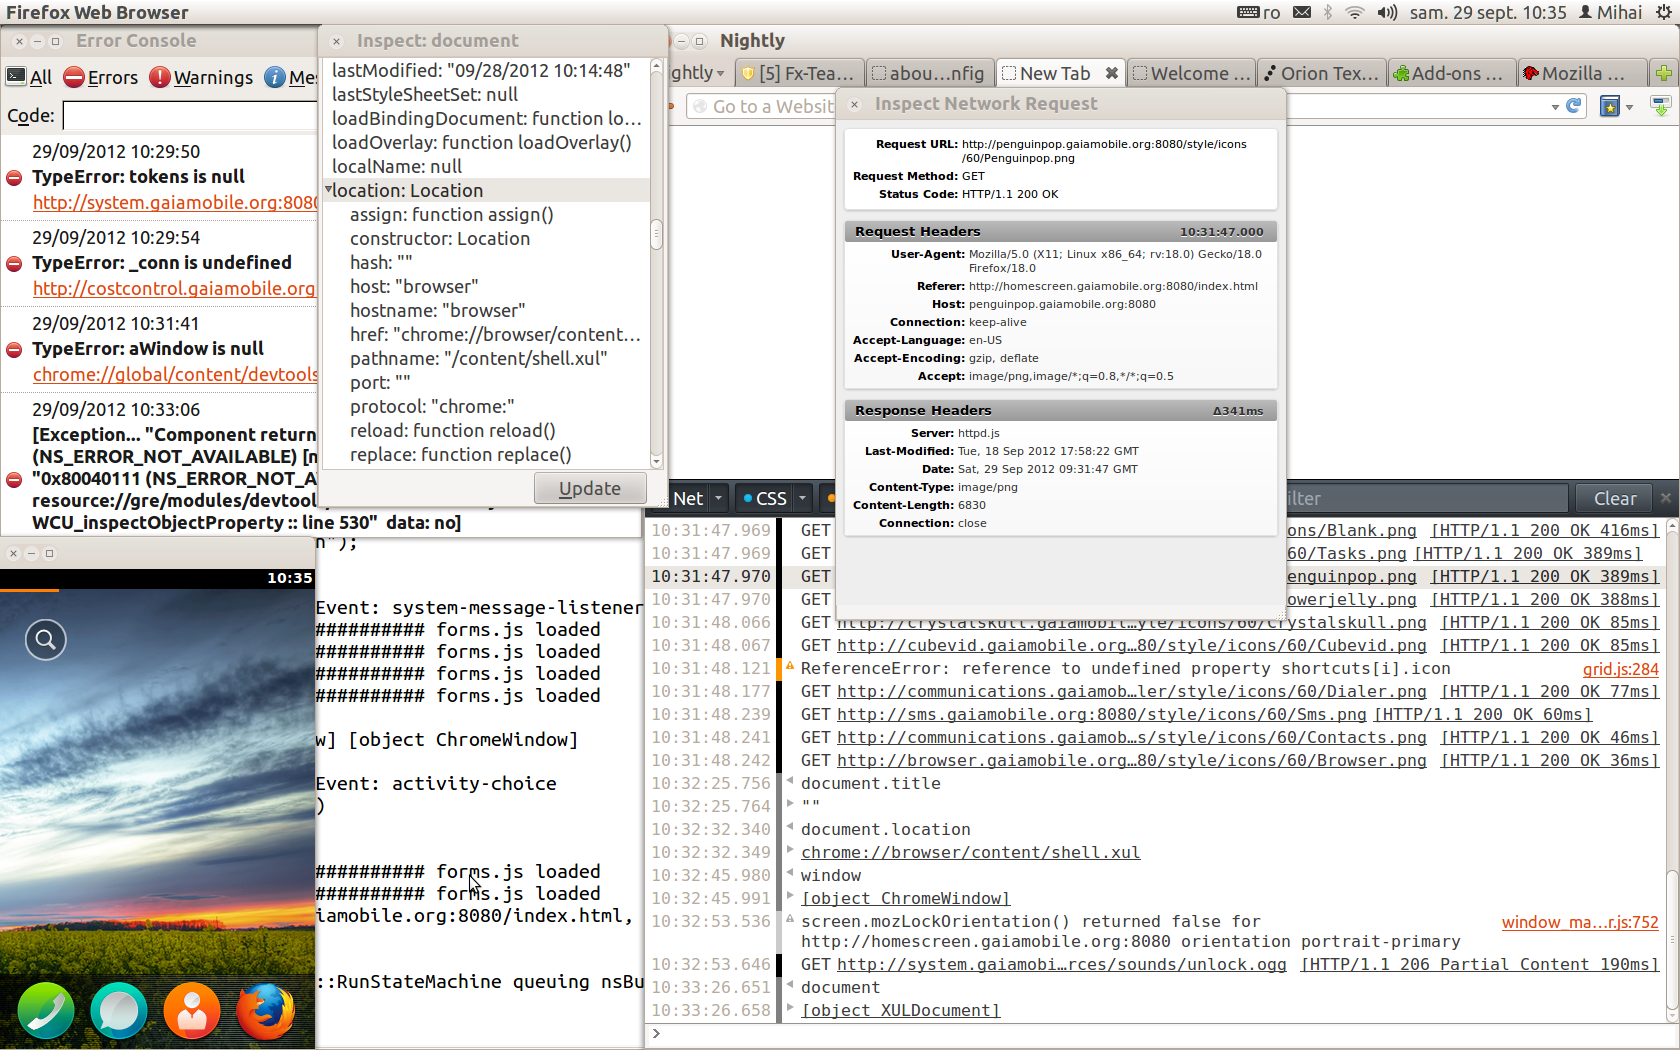
Obligatory screenshot:
The screenshot shows the Browser Console with the new object inspector.
What is next
All of the three features are the outcome of a lot of work from the entire team. Still, I want to thank Panagiotis Astithas and Jim Blandy for the debugger-related work and reviews, and Victor for
the variables view work.
Download a Firefox nightly build, play with the new features until you break
them. :) Please let us know if you have any comments and report any bugs you find!
Published in:
devtools, mozilla, web console.
10 October 2012, 15:49
Hello world!
Here is a summary of the improvements we have made to the Web Console in the latest versions of Firefox. In the new
Firefox 16 release we have added the ability to display Content Security Policy warnings and errors. We are also highlighting network requests that happen over HTTP on HTTPS pages (and vice-versa),
and we did more output performance fine-tuning.
In the new Firefox Beta we have moved the Web Console UI into its own <iframe> - which
gives us better flexibility for upcoming work we will do. We changed the UI to match the developer tools theme and we made
objects you pass to console.log() inspectable. For example, if you call
console.log(document) you can click [object HTMLDocument] to inspect it. JavaScript input autocomplete
also received a number of improvements. Last, but not least, now you can zoom in/out the text in the Web Console - just
press
Ctrl-- / Ctrl-+. The default font size should also match your system's font size settings.
In the new Firefox Aurora release we landed a big chunk of work that makes the Web Console remotable -
we now make use of the Remote Debugging Protocol.
This means you will be soon able to connect Web Console instances to your B2G, Fennec or other Firefox for desktop
browser instances. We currently lack UI to allow you to do this, but we are working on it. This work also paves the
way to a Global Console that could replace the Error Console, some day.
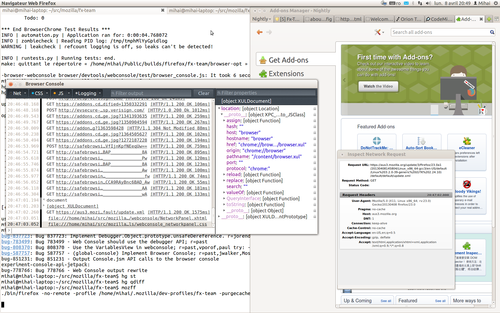
At the end of September the developer tools team had a
meetup in London. There I had the chance to
demo the Web Console client connected to a B2G server:
In the above screenshot you can see the Web Console client running in a local Firefox for desktop build while
connected to a local build of B2G Desktop running Gaia. You can
see network logging, object inspection, network request/response information and script errors coming from B2G.
To learn more about the Web Console remoting capabilities see
bug 768096 and the
wiki page on MDN. To follow the progress with B2G integration see bug 795691.
What is next? We are going to complete work on B2G integration, improve the way Web Console output works,
and we will probably add a Global Console. We also plan to improve the user experience of the object inspector and the
network panel.
Published in:
b2g, devtools, firefox, mozilla, web console.
6 June 2012, 10:35
Hello Mozillians!
For the Aurora update that's happening this week we have some major changes under the hood for the Web Console.
Async Web Console
Work on making the Web Console UI async, decoupled from all the error and network listeners, started in July last year
(bug 673148). Even if it took almost one year to get
this bug fixed, I worked on these patches for about 3 months (loosely summing up the total days of work spent on this
specific bug).
Back in those months we strongly pushed for various developer tools to land and get enabled by default in
Firefox. I've been working a lot on the source editor which was needed for the Style Editor, the JS debugger and
Scratchpad. Work on the Web Console was on and off.
There was modest to good progress for the Web Console async work until around September - October when Mozilla's
electrolysis project was re-prioritized. The initial work on the patch started out with the goal of making the Web
Console ready for e10s. When priorities changed, I went back to source editor work which was higher priority at that
point.
In January - February a really brave and courageous contributor, Sonny Piers, took the huge patch and rebased it. His
efforts were commendable given the size and complexity of the work that was going on. Thank you Sonny!
In March I resumed work and I strongly focused on completing the async patches. Last week the last patch landed
in the nightly builds of Firefox.
What changed? Most of the Web Console was implemented in a single file, HUDService.jsm.
It had everything - from UI code to all the error and network listeners and stuff for the window.console API.
We have now broken that code into separate scripts with the goal to leave
HUDService.jsm as the script that implements only the UI. The new HUDService-content.js script
implements all the listeners, all the "backend stuff". The UI code must no longer directly access the content window and
objects from the content document.
Why? This work allows us to move to the remote debug protocol and to have the Web Console UI connect to
your Firefox Mobile or B2G device where all the error and network listeners are instanced. This work paves the way to a
remotable Web Console.
The added benefit is that the async-ness had some modest performance benefits to content scripts (pages) that used the
window.console API - a call to any method no longer had to wait for the Web Console UI parts to update.
In the future other Firefox components and extensions can build different UIs on top of the data collected by the
HUDService-content.js script.
Lessons learned:
- Focus, focus and focus! Given big projects one must not try to do everything else.
-
Do not underestimate the time it takes to polish working code, to make it ready for review. I had working code in
September-October, but getting it "done" took quite more.
-
Make sure your manager is aware there's a ton of work to do on your project. There's high temptation to be nice and
be helpful and do a lot of other work in between. ;)
-
Aggressively split your work into smaller chunks.
- Be lazy - avoid doing work you don't need to do for the given goal project.
Thanks go to Rob Campbell, Dave Camp, Felipe Gomez, Ms2ger, Joe Walker, Sonny Piers and everyone else who contributed
to getting these patches to be ready to land.
Improved performance
Building on top of the async Web Console work we've also made some really nice output performance improvements (bug 722685). In bug 746869 Boris Zbarsky analyzed the performance
issues in our code and he made a number of valuable suggestions on how we can make it faster. Thank you Boris!
Our first attempt to make the Web Console output faster has landed in Firefox. Let's go straight for the numbers:
-
Opera 12 (post-beta, latest snapshot, with "cutting-edge" Dragonfly):
-
Chromium 18 (beta):
-
Closed console:
- Simple string: 21 ms
- Interpolation: 11 ms
-
Open console:
- Simple string: 66 ms
- Interpolation: 68 ms
Performance in content pages is very good. However, display performance is actually poor. First run is fast.
Subsequent runs take far more. The web inspector tool UI is frozen for many seconds when the second and third
runs happen. Content process separation helps a lot. Even if Web Inspector's display is frozen, web pages
continue to run smoothly.
-
Firefox 13 (without the async patches):
-
Firefox 15 nightly (with the async patches landed):
-
Firefox 15 Aurora (with the performance patch landed):
-
Closed console:
- Simple string: 50 ms
- Interpolated string: 48 ms
-
Open console:
- Simple string: 51 ms
- Interpolated string: 48 ms
For comparison: do note that 1000 dump() calls take around 10-20 ms in Firefox. (dump() is a dumb method we use to output messages to STDOUT.)
Having the Web Console open or closed no longer directly impacts console API calls. Now the UI no longer
freezes and results show up quickly.
I tried with 5000 calls and we now do better than Opera's Dragonfly and Chrome's Web Inspector - in terms of
UI updates. Still, console API calls finish faster, for some reason, in those two browsers.
Please do note that I used the simple test attached
to bug 722685 for testing. These numbers are not meant
to be "scientific" or anything like that - they are based on my machine setup.
We will continue to do further work in improving the output performance (bug 761257). At this point we still need to avoid doing some unneeded work when a lot of messages end up in the queue to be
displayed. We also need to better balance how often and how many messages we display during "heavy fire" - during the
execution of content scripts that invoke the console API methods many, many times for an extended period of time.
What's next?
We have plans to move the Web Console UI into its own
<iframe>, change the UI to match the other developer tools theme, add the option to move the UI
into a real window, make a global console that could replace the Error Console and, obviously, switch to the remote
debug protocol so you can use the Web Console with remote Firefox instances. All this and many other improvements, of
course!
You may wonder "when?" and the answer to that is that all the improvements will come gradually when we get to
implement them.
File bugs, find regressions and let us know what you like and dislike! Thank you!
Published in:
aurora, devtools, firefox, mozilla, performance, web console.