Archive
My avatars
Web Console improvements and the new Browser Console
Article published on:9 April 2013, 21:12
Today we just landed three new Web Console features you can play with in tomorrow's Firefox Nightly builds!
On a related note, Victor Porof also landed the new network monitor which gives you a very nice UI for working with the log of network requests and responses. The new tool uses the Web Console actors we worked on for making the Web Console remotable - both tools share the same network logging mechanism.
Evaluate JavaScript in the current stackframe
Whenever you are debugging a script in the page you can now evaluate JavaScript and inspect objects from the Web Console. Make sure you select in which stackframe you want to evaluate your code - just switch to the desired frame in the Debugger view. Until today the Web Console locked up while debugging pages. For technical details, see bug 783499.
This feature required a number of important changes. The Web Console now uses only the debugger API to access the content JS objects. With these changes we are fixing a number of bugs reports by users.
New object inspector
The old object inspector popup has been replaced with the same variables view from the debugger, allowing us to fix
long standing issues with the old inspector. This is not just pretty UI: you can now filter/search through the
properties by name and value, edit property name and value, delete properties, and more. You can also use
JavaScript helper functions from the web console, inside the variables view: when you edit a value you can just write
$("foo") or whatever you wish.
With this change object inspection works slightly different: you will notice that many of the methods and properties of DOM objects show in the prototype of the objects you inspect. The switch to the debugger API brings the Web Console in line with the JavaScript debugger.
The new Browser Console
To enable the Browser Console make sure you set
devtools.chrome.enabled to true in about:config (Firefox restart is
needed). Open the Browser Console from the Web Developer > Browser Console menu item.
The new Console is meant for browser and addon developers: you can see all of window.console API calls, from all windows, all script and style errors/warnings, and all network requests from all over the browser and from addons.
We plan to replace the Error Console with the Browser Console as soon as possible: the Error Console provides users with less capabilities than the Browser Console, and it is not remotable. You can currently connect to any Firefox Mobile, Firefox OS and Firefox for desktop instance and see all of the logs in the Browser Console from the remote instance.
Given the amount of logging happening we plan to support better ways of filtering output. For example, we would like to allow developers to filter messages by addon.
Obligatory screenshot:
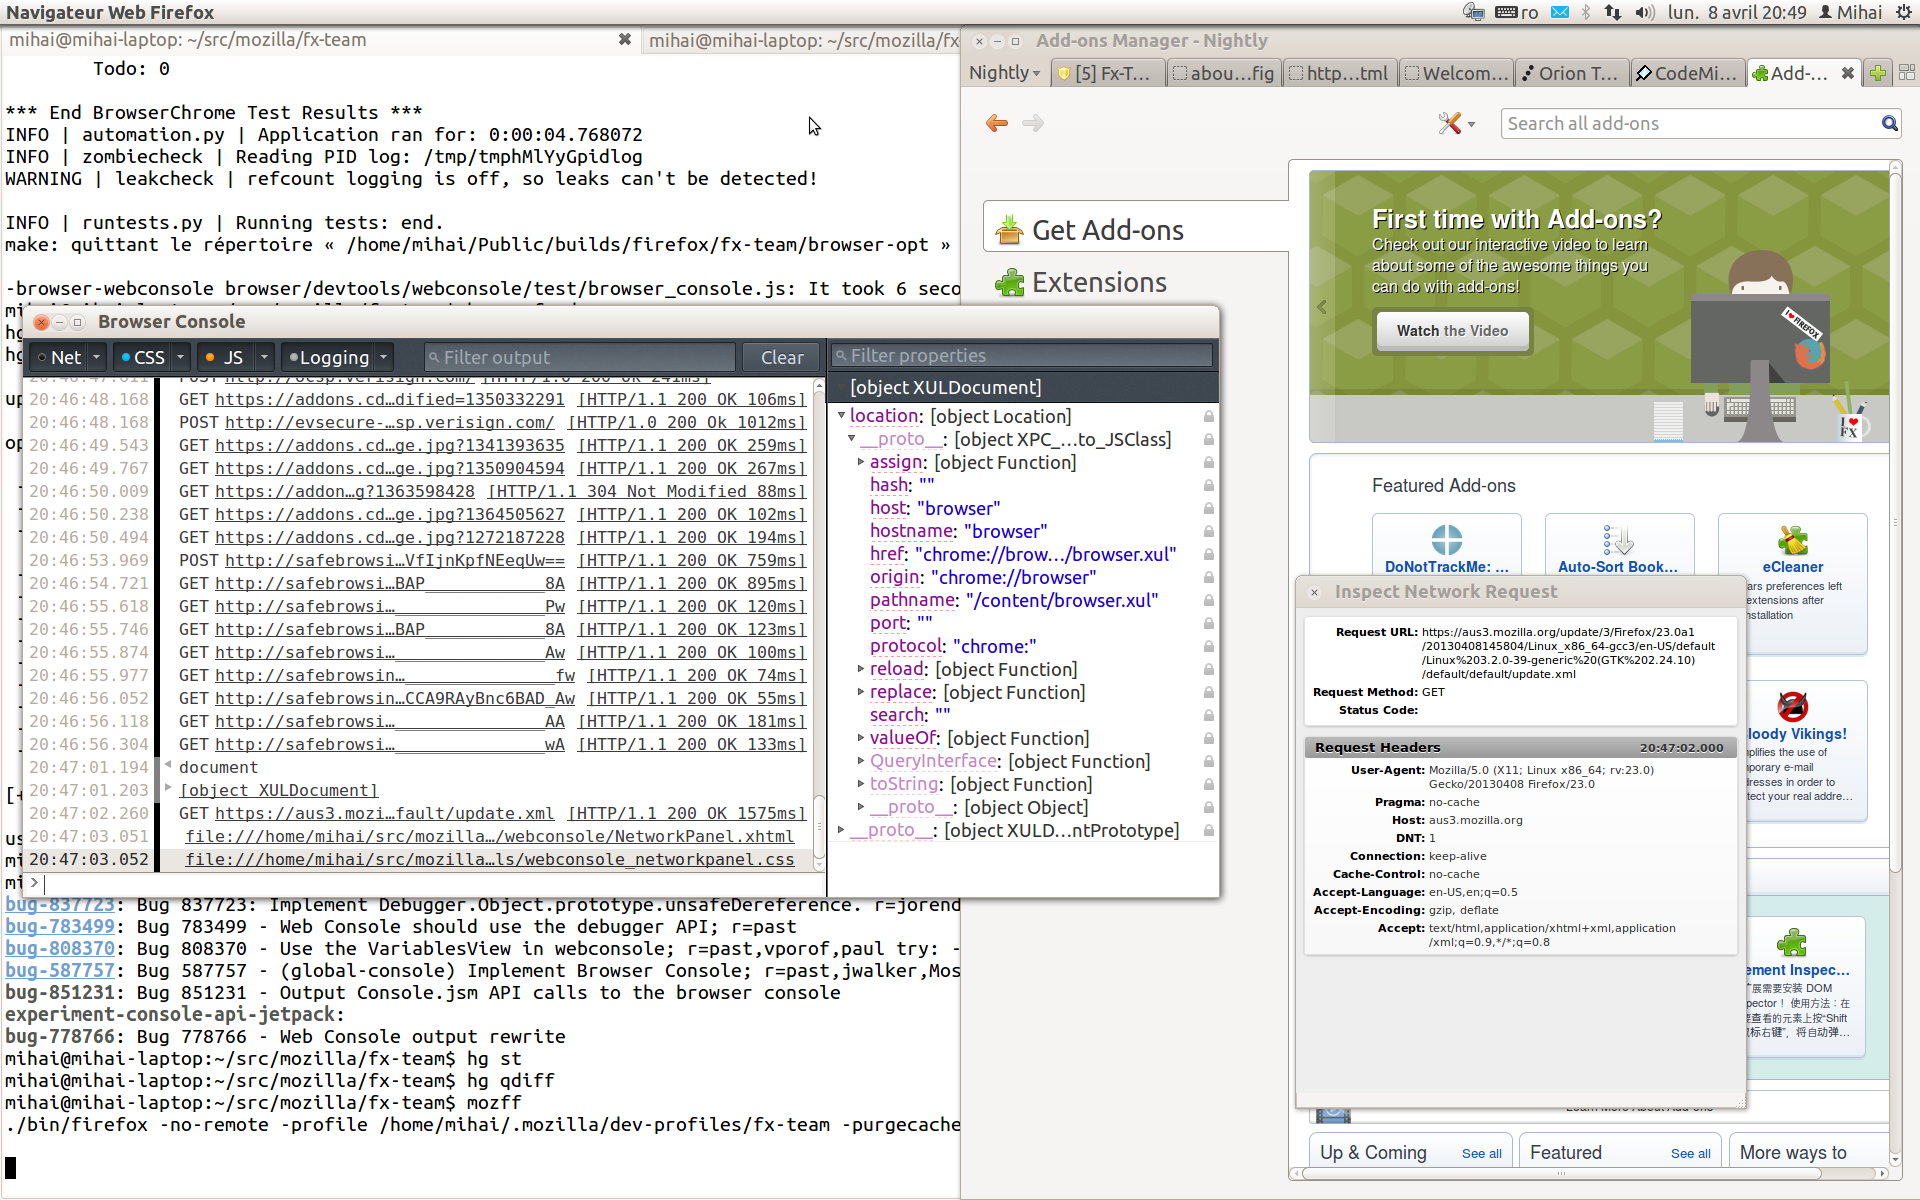
The screenshot shows the Browser Console with the new object inspector.
What is next
All of the three features are the outcome of a lot of work from the entire team. Still, I want to thank Panagiotis Astithas and Jim Blandy for the debugger-related work and reviews, and Victor for the variables view work.
Download a Firefox nightly build, play with the new features until you break them. :) Please let us know if you have any comments and report any bugs you find!